Key Features
-
1 GHz, 10 GS/s, 10 Mpts/ch
-
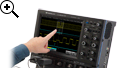
MAUI Advanced User Interface - Designed for Touch, Built for Simplicity, Made to Solve
-
WaveScan - Advanced Search and Find
-
LabNotebook Documentation and Report Generation
-
10.4†Touch Screen Display
-
Spectrum Analyzer Mode
-
Power Analysis Software
-
Serial Trigger and Decode
-
Advanced Debug Toolkit
MAUI - A New Wave of Thinking

MAUI is the most advanced oscilloscope user interface. MAUI is designed for touch; all important oscilloscope controls are accessed through the intuitive touch screen. MAUI is built for simplicity; time saving shortcuts and intuitive dialogs simplify setup. MAUI is made to solve; deep set of debug and analysis tools help identify problems and find solutions quickly.
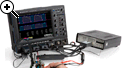
Uncompromised Performance
Many 1 GHz oscilloscopes are available at attractive entry-point prices, however, they are often limited in sample rate, memory or features. The WaveSurfer 10 provides uncompromised 1 GHz performance with up to 10 GS/s per channel and 32 Mpts of memory.
Advanced Debug Toolkit
With the addition of the Advanced Debug Toolkit software, the WaveSurfer 10 becomes an unparalleled debug and analysis machine. The Advanced Debug Toolkit adds:
-
10 GS/s on all 4 channels
-
16 Mpts/ch memory (32 Intlv’d)
-
Sequence Mode Segmented Memory
-
History Mode Waveform Playback
-
13 Additional Math Operators
-
2 Math Functions
This all-inclusive powerful debug package enables the WaveSurfer 10 to perform advanced analysis on long captures with 10x oversampling to find the root cause of problems.
Capture Debug, Analyze, Document
Easily accessible measurement, math and debug tools, plus a wide variety of serial data protocol decoders, and active probes ensure the WaveSurfer 10 can capture and analyze any type of waveform and simplify the debug process. The LabNotebook tool provides a fast way to save waveforms, save setups and screen images, report results, and view offline.
Embedded Controller Design and Debug
Save time when working with embedded controllers by adding high-performance mixed signal capability with the WaveSurfer 10. Capture digital signals up to 250 MHz with up to 10 Mpts/Ch memory, 1 GS/s and 18 channels. In addition, the many triggering and decoding options turn the WaveSurfer 10 into an all-in-one analog, digital, and serial data trigger, acquisition, and debug machine.
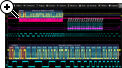
Serial Trigger and Decode Options
Debugging serial data busses can be confusing and time consuming. The serial data and decode options for WaveSurfer 10 provide time saving tools for serial bus debug and validation, such as powerful serial data triggers, intuitive color-coded decode overlays, table summaries and search and zoom.
Supported Serial Data Protocols:
-
I2C, SPI, UART
-
CAN, LIN, FlexRay, SENT
-
Ethernet 10/100BaseT, USB 1.0/1.1/2.0, USB2.0-HSIC
-
Audio (I2S, LJ, RJ, TDM)
-
MIL-STD-1553, ARINC 429
-
MIPI D-PHY, DigRF 3G, DigRF v4
-
Manchester, NRZ
Simple Frequency Domain Analysis with Spectrum Analyzer Mode
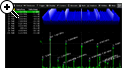
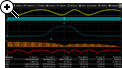
Get better insight to the frequency content of any signal with use of the Spectrum Analyzer mode on the WaveSurfer 10. This mode provides a spectrum analyzer style user interface with controls for start/stop frequency or center frequency and span. The unique peak search automatically labels spectral components and presents frequency and level in an interactive table. Utilize up to 20 markers to automatically identify harmonics and monitor how the spectrum changes over time using the spectrogram which can display a 2D or 3D history of the frequency content.
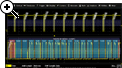
Power Analyzer Automates Switching Device Loss Measurements
Quickly measure and analyze the operating characteristics of power conversion devices and circuits with the Power Analyzer option. Critical power switching device measurements, control loop modulation analysis, and line power harmonic testing are all simplified with a dedicated user interface and automatic measurements. Areas of turn-on, turn-off, and conduction loss are all identified with color-coded waveform overlays for faster analysis.