Yokogawa DLM2000 MSO Series 200MHz-500MHz Oscilloscopes
Description
Compact & intuitive operation
Easy-to-Use & Easy-to-See
Easy to use. Portrait body + large screen makes display easy to see.
We elevated the large (8.4-inch) LCD screen up into the line of sight. Also, the portrait format saves space on the desk or test bench. A compact "personal oscilloscope" designed for easy viewing and ease of use.
Signal Observation on 4 channels or more...
Switch between analog and logic channels
Flexible MSO input
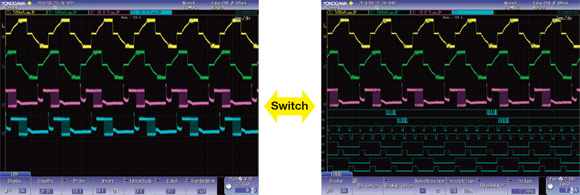
Four channels is not sufficient to view the functioning of digital control circuits. The DLM2000 series converts 4 ch of analog input to 8-bit logic, and functions as a 3 ch analog + 8-bit logic MSO (mixed signal oscilloscope).
 |
|
4 ch analog |
|
3 ch analog + 8-bit logic |
The performance of up to 11 inputs by converting to logic
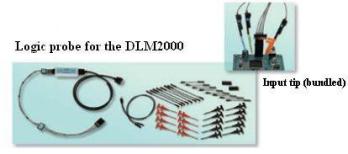
Using logic input, up to 11 input signals can be observed simultaneously as 3 ch of analog and 8-bit logic. It is not only possible to use logic input for observation of data and control signals, or as a trigger source, but also for logic
input analysis of I2C and SPI serial busses.
 |
Fast data processing with ScopeCORE
With our proprietary ScopeCORE fast data processing IC, real time display is possible even signals of 11 inputs.
 |
DLM2000 Series Lineup
|
Item |
Model |
DLM2022
710105 |
DLM2032
710115 |
DLM2052
710125 |
DLM2024
710110 |
DLM2034
710120 |
DLM2054
710130 |
|
Analog Input channels |
2 |
4* |
|
Logic input |
- |
8bit |
|
Maximum sampling rate |
2.5 GS/s (interleave ON) |
|
Frequency Characteristics |
200 MHz |
350 MHz |
500 MHz |
200 MHz |
350 MHz |
500 MHz |
|
Maximum Record Length |
62.5 Mpoints (Single measurement, interleave ON) |
250 Mpoints (Single measurement, memory length: /M3, interleave ON) |
*Or 3 channels when using logic input
Largest long memory within the class
|
|
Continuous Measurement |
Single-Shot Measurement |
|
2 ch, 4 ch same |
With 4 ch (With 2ch for DLM20x2) |
With 2 ch (With 1ch for DLM20x2) |
|
/M1, /M1S memory option (standard) |
6.25 Mpoints |
25 Mpoints |
62.5 Mpoints |
|
/M2 memory option |
12.5 Mpoints |
62.5 Mpoints |
125 Mpoints |
|
/M3 memory option |
25 Mpoints |
125 Mpoints |
250 Mpoints |
Note:The /M1, /M2, /M3 memory expansion options are only available on 4ch models. The /M1S option is only available on 2ch models.
Large capacity memory up to 250 Mpoints
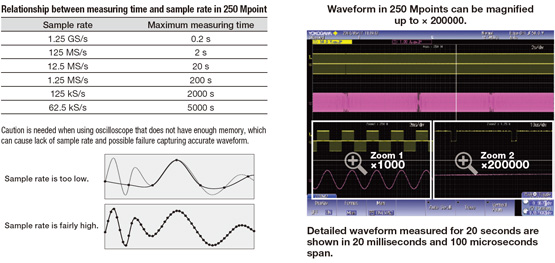
Long memory is necessary to keep high speed sample rate in long term measurement.
<Basic Formula> Measuring time = Memory length/Sample rate
If 250 Mpoints (Memory expansion option /M3) is installed, Max. 0.2 sec waveform can be captured even at 1.25 GS/s sample rate when taking 2 ch measurements in Single mode.
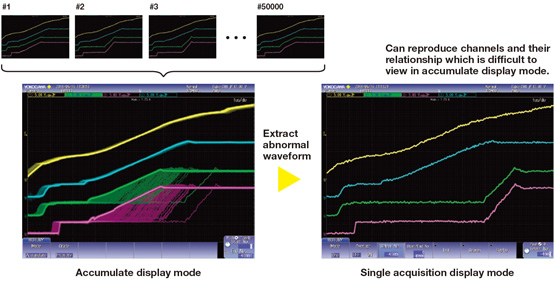
History function - Automatically save previously captured waveform
With the DLM2000 series, up to 50000 previously captured waveforms can be saved in the acquisition memory. With the History function, you can display just one or all of the previously captured waveforms (history waveforms) on screen. You can also perform cursor measurement, computation, and other operations on history waveforms. Using the History function, you can analyze rarely-occurring abnormal signals. History function, you can display just one or all of the previously captured waveforms (history waveforms) on screen. You can also perform cursor measurement, computation, and other operations on history waveforms. Using the History function, you can analyze rarely-occurring abnormal signals.
Trigger function capturing combined analog/digital waveforms
The DLM2000 series comes with a variety of easy-to-configure triggers combining analog and logic inputs such as edge, enhanced, and B triggers.
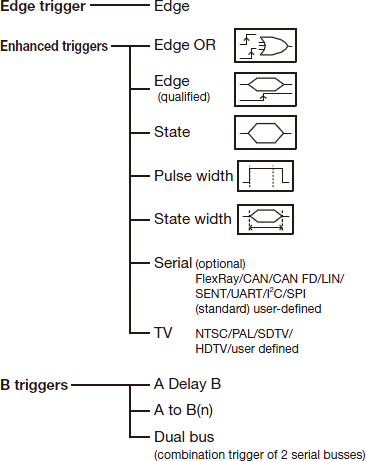
Trigger Function Example
A to B(n) Trigger:
Trigger on the 7th edge of signal on B. This is effective for measurements with shifted timing, such as non-standard video signal vertical/horizontal periods or motor reference position pulses and drive pulses. |
 |
Serial Pattern Trigger (user defined):
Trigger on an arbitrarily set pattern of up to 128 bits. This is effective for detecting ID/Data and other portions of proprietary communication formats. |
 |
Dual Bus Trigger:
Trigger on a combination of CAN and LIN bus triggers. I2C + SPI bus triggers, and other combinations are possible.
Trigger when either LIN or CAN bus signal conditions become true. |
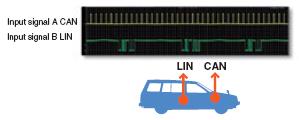
|
Specifications & Detail 
Capture & Display Zoom and Search Functions
Real time Filter with optimum noise reduction supports a wide range of frequencies (from 8 kHz to 200 MHz)
The DLM2000 series has two types of filters, one processed at the input circuit and one based on MATH functions. These filters are effective for rejecting unwanted signals, allowing observation of only the desired bandwidths.
|
Real Time Filters
Each channel has 14 low pass filters available from 8 kHz to 200 MHz. Waveforms of limited bandwidths are stored in internal memory.
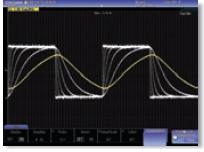
Cutoff Frequencies:
200 MHz, 100 MHz, 20 MHz, 10 MHz, 5 MHz,
2 MHz, 1 MHz, 500 kHz, 250 kHz, 125 kHz,
62.5 kHz, 32 kHz, 16 kHz, and 8 kHz
Processing with built-in filters
|
|
Computed Digital Filters
The input waveform can be filtered using an IIR filter, which is a MATH function. Filtered waveforms can be displayed at the same time as the input waveform for comparison. You can select low pass or high pass filters.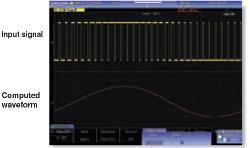
Cutoff Frequency Setting Range:0.01 Hz to 500 MHz
Filtering of a PWM waveform using computation
|
Zooms into two different points - Waveform zoom and search functions
Zoom two locations simultaneously
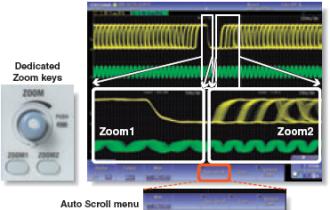
Because the DLM2000 series lets you set zoom factors independently, you can display two zoomed waveforms with different time axis scales at the same time. Also, using the Auto Scroll function, you can automatically scroll waveforms captured in long memory and change the zoomed location. With Auto Scroll you can choose forward, backward, fast-forward, scroll speed, and other control options. |
 |
Large capacity memory gives you a variety of waveform search functions
Two types of waveform searching:
Normally, searching for data takes time and costs money, and long memory is useless without functions for extracting desired data from a large capacity memory. That's why the DLM2000 series does not simply offer long memory, it also provides powerful waveform search functions.
Useful Functions - Fastest and most capable analysis
Display trends of peak-to-peak or pulse width per cycle
Measure function and statistics
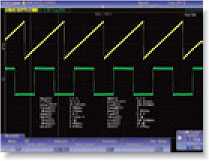
Twenty-eight waveform parameters are included such as: maximum, minimum, peak-to-peak, pulse width, period, frequency, rise/fall time, and duty ratio. Automated measurement can be performed using up to 20 of these waveform parameters. Also, waveform parameters can be measured repeatedly, and the statistical values displayed (mean, maximum, minimum, standard deviation, etc.).
|
 |
Trend and histogram displays
Waveform parameters such as period, pulse width, and amplitude can be measured repeatedly and displayed in graphs. In a single screen you can observe period-by-period fluctuations, compute amplitudes every screen using multiple waveforms, and display amplitudes as trends. You can also display histograms referencing the voltage or time axis using values from repeated automated measurement of waveform parameters. |
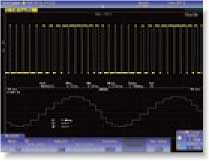
Trend display of waveform parameters
Histogram display using the time axis |
Measures voltage/time differences automatically
- Cursor Measurement -
Cursors can be placed on the displayed waveform from signal data, and various measurement values at the intersection of the cursor and waveform can be displayed. There are six types of cursor; ΔT, ΔV, ΔT& ΔV, Marker, Degree Cursor.
|
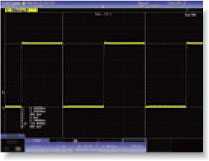
Simultaneous level and with the ΔT&ΔV cursor |
Analyzes Frequency Spectrums
- FFT Analysis -
Up to 2 FFT analyses can be performed simultaneously. FFT can be performed on computed waveforms in addition to the actual waveforms on CH1 to CH4. Analysis can be performed of the frequency components of waveforms filtered for limited bandwidth, of frequency for changes in period of rotary objects, and other phenomena.
|
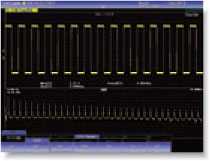 |
Keeps waveforms with one push
By pressing the SNAPSHOT key to the lower right of the screen, you can freeze a white trace of the currently displayed waveform on the screen. You can press the key repeatedly and conveniently leave traces for comparing multiple waveforms. Also, snapshot data recorded on screen can be saved or loaded as files, and can be recalled for use as reference waveforms when making comparisons. |
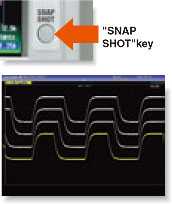 |
Displays stored files in thumbnail format
Thumbnails of waveform data, waveform image data, and Wave-Zone files can be displayed. The image and file names are shown so that you can view screen image contents while copying or deleting files. A file can be enlarged to confirm the data. |
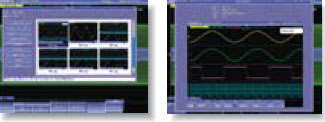
Thumbnails of saved filesThumbnail can be viewed full-size |
Has a GO/NO-GO function
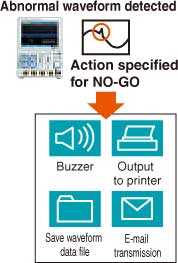
GO/NO-GO can be determined using trigger conditions, zone waveforms, measurement parameters, and other criteria. For NO-GO, actions can be carried out at the same time such as sounding a buzzer, saving the current waveform, or sending notification to a designated e-mail address. Waveforms in which an abnormality occurred can be saved for confirmation and analysis of the phenomena at a later time.
|
 |
Can check functions with graphical online help
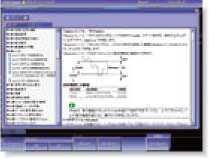
You can view detailed graphical explanations of the oscilloscope's functions by pressing the "?" key in the lower left of the screen. This lets you get help on functions and operations on screen without having to consult the user's manual.
|
|
Additional Option License for DLM2000
This is a license product for adding applicable optional features on to DLM2000 series on your own.
It is necessary to update main unit firmware in advance to V3.00 and above* in order to apply this license.
This license is only valid for 4 ch models.
* Firmware version 3.70 or higher is required to apply -F7, -F8, -F9, -X1 licenses.
|
Model |
Suffix code |
Description |
|
709810 |
-G2 |
User defined math (4 ch model only) |
|
-G3 |
Power supply analysis function (4 ch model only) |
|
-G4 |
Power supply analysis function (includes G2) (4 ch model only) |
|
-F1 |
UART trigger and analysis (4 ch model only) |
|
-F2 |
I²C + SPI trigger and analysis (4 ch model only) |
|
-F3 |
UART + I²C + SPI trigger and analysis (4 ch model only) |
|
-F4 |
CAN + LIN trigger and analysis (4 ch model only) |
|
-F5 |
FlexRay trigger and analysis (4 ch model only) |
|
-F6 |
FlexRay + CAN + LIN trigger and analysis (4 ch model only) |
|
-F7 |
CAN+CAN FD+LIN trigger and analysis (4 ch model only) |
|
-F8 |
FlexRay+CAN+CAN FD+LIN trigger and analysis (4 ch model only) |
|
-F9 |
SENT analysis (4 ch model only) |
|
-X1 |
F4 -> F7 or F6 -> F8 (adds CAN FD) |
Serial analysis function options (/F1 to /F9)
- UART (RS232)/I²C/SPI/CAN/CAN FD/LIN/FlexRay/SENT -
Triggers for embedded systems and in-vehicle bus signals are supported along with decode display analysis (serial bus analysis option only on 4 ch models). Logic input can also be used for serial buses (excluding FlexRay, CAN, CAN FD and LIN).
Intelligent serial bus auto setup:Complicated trigger and decode settings such as bit rate and threshold level are automatically detected by DLM2000.
Simultaneous analyses of four different busses:Up to four busses can be analyzed simultaneously. Waveforms and analysis results from busses with different speeds can be displayed using 2 Zoom windows.
Inputs supported for serial bus analysis
|
|
I²C |
SPI |
UART |
;LIN |
CAN |
CAN FD |
FlexRay |
SENT |
|
Analog Input |
Yes |
Yes |
Yes |
Yes |
Yes |
Yes |
Yes |
Yes |
|
Logic Input |
Yes |
Yes |
Yes |
NA |
NA |
NA |
NA |
Yes |
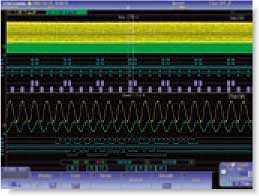
Simultaneous analyses of I2C and SPI
|
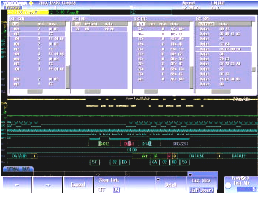
Four bus decode and list display
|
Power Supply Analysis Option (/G3, /G4)
Dedicated power supply analysis options are available (4 ch models only) for switching loss, joule integral (i2t), SOA (safe operating area) analysis, harmonic analysis of power supply current based on EN61000-3-2, and other power parameter measurement such as active power, power factor etc.
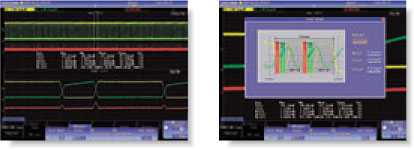
Switching Loss Analysis
Utilizing the long memory capability, voltage and current waveforms over
long cycles can be input for computation of switching loss (V(t) X i(t)).
A wide variety of switching loss analyses are supported, including turnon/
off loss calculation, loss including conduction loss, and loss over long
cycles of 50 Hz/60 Hz power line. |
|
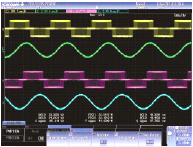
Power parameter measurement
Automated measurement of power parameters for up to
two pairs of voltage and current waveforms, such as
active power, apparent power, power factor etc. Values
can be statistically processed and caluculated. |
 |
-
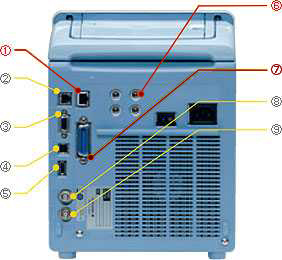
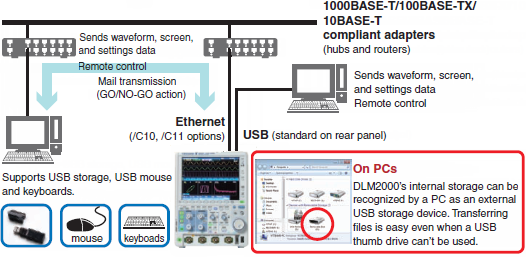
Ethernet (optional)
-
Supports 1000BASE-T, 100BASE-TX, 10BASE-T
-
GO/NO-GO I/O terminal
-
Using the GO/NO-GO function, you can output the result of the waveform judgement asa TTL level signal.
-
RGB video signal output terminal
-
You can output an image signal and check the waveform on an external monitor.
-
USB-PC connection terminal
-
Enables control from a PC.
-
USB peripheral connection terminal
-
Supports USB storage, USB keyboards, USB printers.
-
Probe power terminal (optional)
-
Power supply output terminal for current probes (701930 and 701931) and differential probes (701920, 701921, 701922, 700924, 700925, and 701926).
-
GP-IB connection terminal (optional)
-
Enables control from a PC.
-
Trigger output
-
Outputs a CMOS 3.3V level trigger signal.
-
External trigger input
-
Lets you input a trigger signal separately from the input signal.
Data Sheet & Downloads 
|
|